What a Single HRV Value Can and Can't Tell You
Yakiv Bilenko — editor · Updated October 5, 2026
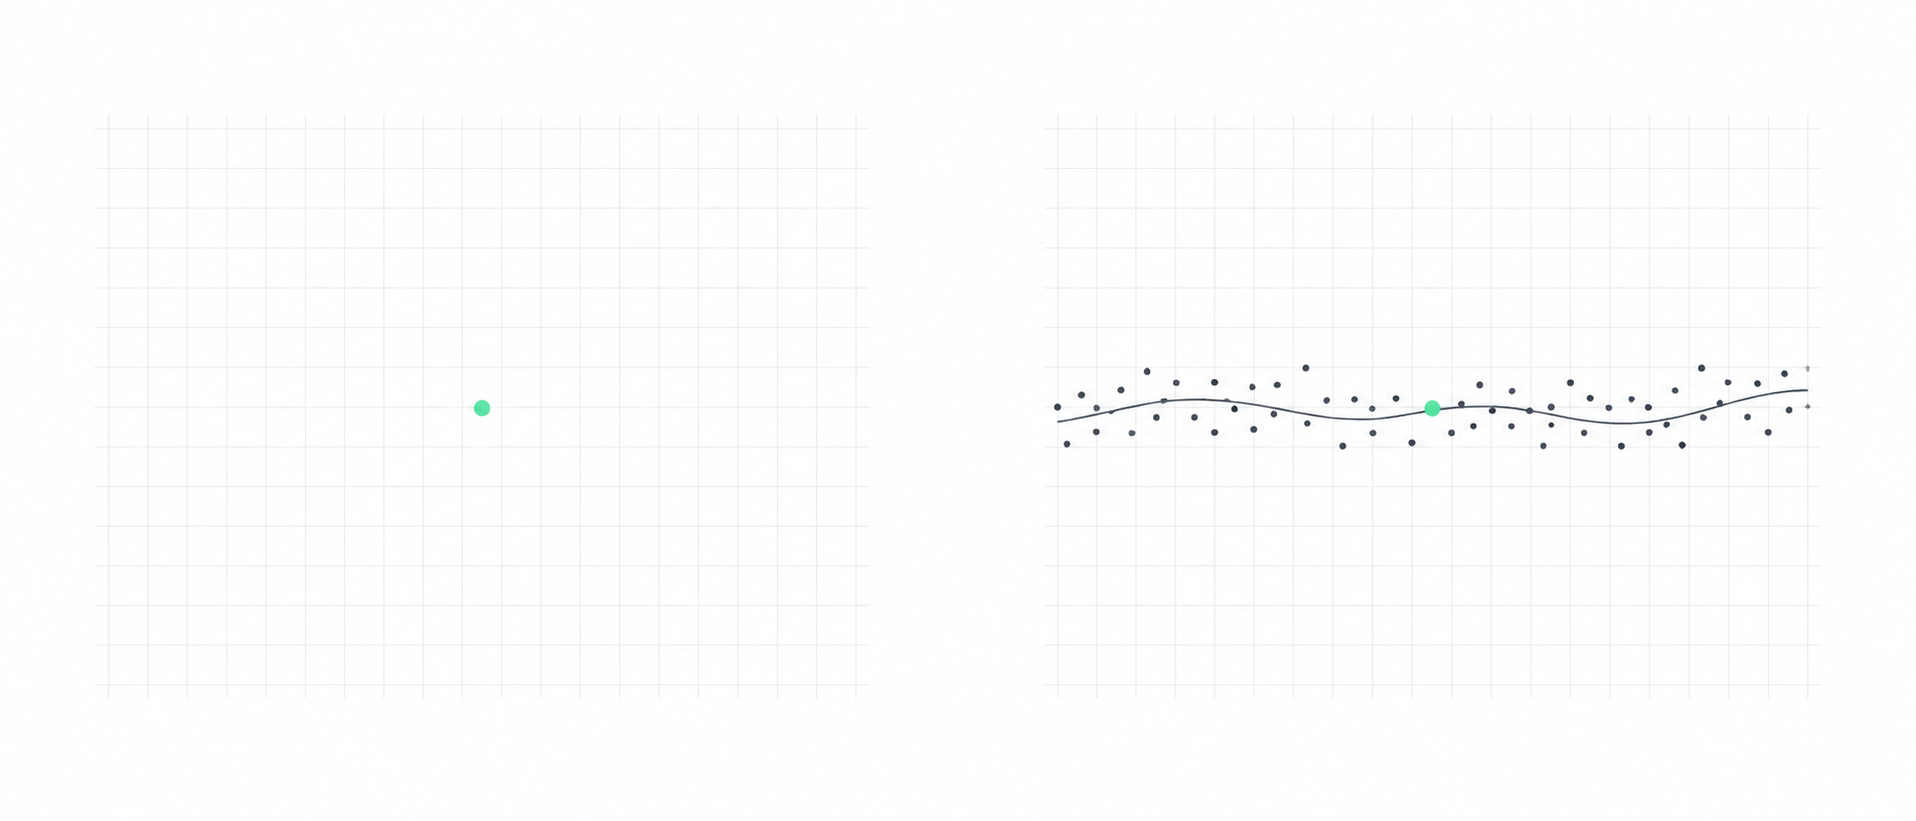
A single HRV value is a snapshot of how much vagal influence shaped your heart rhythm at that moment, in those conditions, measured by that device. It is used to compare you with your own recent readings. It is influenced by sleep, alcohol, illness, training, breathing and the quality of the recording. It does not by itself establish stress, illness, fitness or how you rank against other people.
Key points
- One HRV value describes vagally mediated heart-rhythm variation at one moment, under one set of conditions, from one device.
- A single low reading is not a diagnosis and does not by itself mean you are stressed or unwell.
- A very high value is not automatically good: irregular beats and recording artefacts can inflate HRV, so it is a reason to check the data.
- Comparing your HRV with another person's is close to meaningless, because healthy people differ widely and age, metric and device all change the number.
- Readiness and recovery scores are manufacturers' own formulas built on top of HRV and other inputs, not standard scientific measures.
- In patient groups and large populations low HRV is associated with worse outcomes, which is not a prediction for one healthy person.
- A sustained shift from your own baseline together with symptoms is worth attention; a single number is not.
What can a single HRV value tell you?
One heart rate variability value answers a narrow question: how much did the time between heartbeats vary during that recording? Most of that short-term variation comes from vagal influence on the heart. The framing matters. Vagal tone cannot be measured directly; HRV measures such as RMSSD reflect vagally mediated changes in heart rate [S3].
So a reading describes your heart rhythm at that moment, in those conditions, as captured by that device and summarized by that metric. Change any of these and the number changes: the signal source (chest ECG or optical pulse), the length of the recording, where it was taken, how you were breathing and how it was analysed all shift the result [S4]. A short daytime reading and a night-long average are not the same quantity, and values from recordings of different length cannot be compared directly [S2]. RMSSD and SDNN are different metrics, and how a watch or ring estimates HRV adds its own error.
That is all one number can say. It is easy to read more into it than it holds [S3].
Why is HRV so personal?
"You can compare your HRV with a friend's." Hardly at all. Healthy adults differ enormously in HRV [S6], and a lower value than a peer's does not necessarily mean poorer physiological status [S5]. On average HRV falls with age — HRV tends to fall with age — in our night-time RMSSD table the median drops by about 4–8 ms from one age band to the next [S7] — and the metric, the device, the time of day and the recording length differ between any two people's numbers [S4]. A friend's higher reading tells you nothing about your health.
The useful comparison is with yourself: your own readings, taken the same way, over days and weeks. How that works is the subject of the HRV baseline. Age tables are in normal HRV by age; read them as group context, not as a target.
When is a high value a reason to check the data?
"Higher is always better." In sports science, HRV at or above your own baseline is used as one of the signs of recovery: in one small randomized trial, hard sessions were scheduled only on mornings when HRV had not dropped [S18]. But a higher number is not always a better one. HRV is computed from the intervals between beats, so anything that makes those intervals irregular for reasons other than normal vagal rhythm raises the number. Abnormal beats and noise can masquerade as HRV [S2].
- Extra beats and arrhythmia. Ectopic (premature) beats and atrial fibrillation count as physiological artefacts in the beat-interval series [S8]. Ectopic beats add mathematical artefact to both time- and frequency-domain measures, and leaving them uncorrected significantly altered HRV in simulations [S9].
- Recording artefacts. Loose contact and movement create false beats; such beats are common and can make a reliable analysis difficult or impossible [S8].
- Erratic sinus rhythm. In one cohort of older adults, abnormal heart-rhythm patterns that raised many HRV indices were common and were associated with higher, not lower, mortality [S10] (single observational study). Researchers describe this as high short-term HRV that reflects a breakdown of heart-rhythm control rather than healthy vagal influence, and are developing measures such as heart rate fragmentation to separate the two [S11] (emerging research).
A sudden, unusually high value is therefore a reason to check the data — was the device loose, were you moving, does the pulse feel irregular — before treating it as good news.
What can make a reading low?
Many factors move HRV [S4]. The ones most commonly reported are:
- a short or poor night's sleep;
- alcohol;
- an illness starting, such as a cold or fever;
- a hard training session or a heavy training block;
- measurement conditions: a different time of day, posture, movement, talking or a loose sensor.
How each of these works, and how large the effects are, belongs to the planned page on why HRV changes from day to day. Practical next steps after a low reading are in what to do after a low HRV reading, and the Apple Watch specifics in why your Apple Watch HRV is low.
A single low HRV reading does not by itself mean you are stressed or unwell [S1]. A single low value is not a diagnosis and not a measurement of stress; it is one point that only gains meaning next to your own recent readings.
What does the evidence show?
Established — population risk. In patient groups and large populations, low HRV is associated with worse outcomes. The classic study by Kleiger and colleagues measured SDNN from all-day ECG recordings in people after a heart attack: lower HRV was associated with higher mortality and remained a significant predictor after adjustment for other clinical factors [S14]. Its thresholds cannot be compared with the SDNN an Apple Watch shows, because the watch calculates SDNN from short readings, not from a whole day of ECG. In population studies of people without known heart disease, mostly with ECG recordings, a meta-analysis found about 32–45% higher risk of a first cardiovascular event in those with low HRV [S15]. In patients with cardiovascular disease, a meta-analysis of cohort studies found lower HRV associated with a higher risk of death and of cardiovascular events [S16].
These are population associations from clinical-grade ECG recordings, mostly in patients or older adults. They do not transfer to a single value from a watch: one reading does not tell a healthy person their risk, and these studies do not show that raising your HRV lowers it.
Context-dependent — readiness and recovery scores. Many apps and wearables turn HRV, resting heart rate, sleep and other inputs into a single readiness or recovery score. These are each manufacturer's own formulas: an analysis of HRV apps found that many such scores rely on proprietary algorithms that are not transparently described, so it is hard to assess independently how they were derived and validated [S12]. A review of smartwatch metrics describes readiness scores as algorithmic estimates rather than direct physiological measurements, and finds wearable data most useful for within-person trends rather than diagnosis or cross-device comparison [S13]. A score can be a convenient summary, but it is not a standard scientific metric, and two brands' scores are not comparable.
Context-dependent — single readings. HRV findings are easy to misread without their measurement context [S3]. What holds up best is the direction of your own readings over time, taken under similar conditions.
What it does not tell you
- Not your stress level or a diagnosis. One value says nothing specific about your mental state or about disease [S1].
- Not your rank. A higher or lower number than someone else's says little about either of you [S5] [S6].
- Not your fitness or "readiness". Neither the raw value nor a proprietary score is a validated measure of these on its own [S12] [S13].
- Not a personal risk forecast. Population risk findings do not apply to one healthy person's reading [S15] [S16].
- When HRV is worth attention. A shift away from your own baseline that lasts many days, together with symptoms such as unusual tiredness, poor sleep, fever or a racing or irregular pulse, is worth noticing — the number is a prompt to look at how you feel, not the finding itself.
- When to see a doctor. As a general precaution, see a doctor if you notice an irregular pulse, palpitations, or a lasting change in your readings that comes with symptoms. Seek urgent care for chest pain, fainting, or severe breathlessness. If you take your data to an appointment, doctors and your data explains what helps, with guides for the GP and the cardiologist.
More everyday questions are answered in HRV questions answered, and you can work through your own numbers in the HRV calculator.
In ONDA
ONDA reads HRV (SDNN) from Apple Health, written there by an Apple Watch or another device that syncs heart data [S17]; the iPhone camera gives pulse, not HRV. ONDA never judges a single value against other people. ONDA compares each night with your own corridor — the average of your recent nights plus or minus one standard deviation — and flags a night only when it is at least 1.5 standard deviations outside and has changed by a minimum amount. These signals are descriptive comparisons with your own baseline, not measurements of stress [S17]. ONDA has no single readiness or recovery score and does not diagnose anything. See what ONDA measures.
Educational information, not a diagnosis or medical treatment.
Evidence at a glance
| Claim | Evidence | Limitation |
|---|---|---|
| HRV reflects the parasympathetic (cardiac vagal) contribution to heart regulation only indirectly; vagal tone itself is not measured. [S3] | Established | An index of vagal influence on the heart, not a direct measurement of nerve activity. |
| HRV values depend on the input signal, recording length and location, breathing and the analysis method. [S4] | Established | Methodological guideline for research; the same factors apply to self-tracking. |
| Recording length changes HRV, so values from recordings of different length cannot be compared directly. [S2] | Established | General property of HRV metrics. |
| HRV findings are easy to over-interpret without methodological context. [S3] | Context-dependent | Methods review addressed to researchers. |
| A single low HRV reading does not by itself mean stress or illness; HRV is a risk-stratification research tool, not a specific marker of a state. [S1] | Established | Classic guideline statement; persistent changes with symptoms belong with a clinician. |
| Many experimental, demographic and environmental factors influence HRV and its reliability. [S4] | Established | General statement; the individual factors and their effect sizes are covered on the planned page on day-to-day changes. |
| Abnormal beats and noise can masquerade as HRV. [S2] | Established | Data-quality caution; artefact handling differs between devices. |
| Ectopic beats and atrial fibrillation are physiological artefacts in the beat-interval series; poorly attached electrodes and movement cause technical artefacts. [S8] | Established | Review of ECG-based editing methods; wrist and finger optical sensors have their own artefacts. |
| False beats are common in beat-interval recordings and can make reliable HRV analysis difficult or impossible. [S8] | Established | Ambulatory ECG context. |
| Ectopic beats introduce mathematical artefact into time- and frequency-domain HRV; leaving them uncorrected significantly altered HRV in simulations. [S9] | Established | Computer simulation with added premature beats in short recordings; size of the effect depends on how many beats are abnormal. |
| In older adults, abnormal heart-rhythm patterns that raise many HRV indices were common and associated with higher mortality (single cohort). [S10] | Context-dependent | One observational study in older adults in sinus rhythm; not tested in young healthy wearable users. |
| With ageing and cardiovascular disease, high short-term HRV that reflects a breakdown of heart-rhythm control may confound traditional HRV analysis. [S11] | Emerging | Single analysis of archived Holter recordings proposing new metrics; heart rate fragmentation is a research measure. |
| Comparing your HRV with a peer's is misleading: a lower value than someone else's does not necessarily mean poorer status. [S5] | Context-dependent | Narrative review in athletic populations. |
| Healthy adults differ very widely in HRV. [S6] | Established | Short-term daytime protocols; largest for spectral measures. |
| On average HRV falls with age, while individuals vary widely. [S7] | Established | Cross-sectional group averages; not individual predictions. |
| Many consumer HRV apps offer readiness or recovery scores based on proprietary algorithms that are not transparently described. [S12] | Established | App store content analysis of English-language apps at one point in time; scores change with updates. |
| Many smartwatch outputs, including readiness scores, are algorithmic estimates rather than direct physiological measurements; their validity varies by device and algorithm. [S13] | Established | Narrative review; does not evaluate any single product. |
| Smartwatch data are most useful for within-person trends; caution is needed for diagnosis and cross-device comparison. [S13] | Context-dependent | Narrative review. |
| After acute myocardial infarction, low all-day SDNN was associated with higher long-term mortality and remained a significant predictor after adjustment. [S14] | Established | Single cohort of post-infarction patients with all-day ECG; its SDNN is not comparable with short-reading wearable SDNN; a population association, not a prediction for a healthy person. |
| In populations without known cardiovascular disease, low HRV was associated with a higher risk of a first cardiovascular event. [S15] | Established | Meta-analysis of eight observational studies, mostly clinical-grade recordings; association, not cause, and not an individual prediction. |
| In patients with cardiovascular disease, lower HRV was associated with a higher risk of death from any cause and of cardiovascular events. [S16] | Established | Meta-analysis of cohort studies in patients; subgroup results differ (not significant in heart failure); not applicable to healthy individuals. |
| In sports science, HRV at or above one's own baseline is used as one of the signs of recovery; in one trial, high-intensity training was prescribed only when morning HRV had not decreased. [S18] | Context-dependent | Single small randomized trial in healthy moderately fit men; describes a training rule, not proof that higher HRV always means better recovery. |
| ONDA reads HRV (SDNN) from Apple Health, written there by an Apple Watch or another device that syncs heart data. [S17] | Context-dependent | Product documentation. |
| ONDA's signals are descriptive comparisons with the personal baseline, not measurements of stress and not a medical assessment. [S17] | Context-dependent | Product documentation scope statement. |
Sources
- [S1] Task Force of the ESC and NASPE (1996). Heart rate variability: standards of measurement, physiological interpretation and clinical use. Circulation. DOI 10.1161/01.CIR.93.5.1043
- [S2] Shaffer & Ginsberg (2017). An overview of heart rate variability metrics and norms. Frontiers in Public Health. DOI 10.3389/fpubh.2017.00258
- [S3] Laborde, Mosley & Thayer (2017). Heart rate variability and cardiac vagal tone in psychophysiological research — recommendations for experiment planning, data analysis, and data reporting. Frontiers in Psychology. DOI 10.3389/fpsyg.2017.00213 · PMID 28265249
- [S4] Carter et al. (2026). Guidelines for rigor and reproducibility of heart rate variability within human cardiovascular research. Am J Physiol Heart Circ Physiol. DOI 10.1152/ajpheart.00041.2026 · PMID 42495990
- [S5] Esco, Fields, Mohammadnabi & Kliszczewicz (2026). Monitoring training adaptation and recovery status in athletes using heart rate variability via mobile devices: a narrative review. Sensors. DOI 10.3390/s26010003 · PMID 41516438
- [S6] Nunan, Sandercock & Brodie (2010). A quantitative systematic review of normal values for short-term heart rate variability in healthy adults. Pacing Clin Electrophysiol. DOI 10.1111/j.1540-8159.2010.02841.x · PMID 20663071
- [S7] Voss et al. (2015). Short-term heart rate variability — influence of gender and age in healthy subjects. PLOS ONE. DOI 10.1371/journal.pone.0118308
- [S8] Peltola (2012). Role of editing of R-R intervals in the analysis of heart rate variability. Frontiers in Physiology. DOI 10.3389/fphys.2012.00148 · PMID 22654764
- [S9] Lippman, Stein & Lerman (1994). Comparison of methods for removal of ectopy in measurement of heart rate variability. American Journal of Physiology. DOI 10.1152/ajpheart.1994.267.1.H411 · PMID 7519408 · computer simulation study
- [S10] Stein et al. (2005). Sometimes higher heart rate variability is not better heart rate variability: results of graphical and nonlinear analyses. Journal of Cardiovascular Electrophysiology. DOI 10.1111/j.1540-8167.2005.40788.x · PMID 16174015
- [S11] Costa, Davis & Goldberger (2017). Heart Rate Fragmentation: A New Approach to the Analysis of Cardiac Interbeat Interval Dynamics. Frontiers in Physiology. DOI 10.3389/fphys.2017.00255 · PMID 28536533
- [S12] de Jager et al. (2026). Mobile Apps for Heart Rate Variability: App Store Search and Content Analysis. JMIR Cardio. DOI 10.2196/84764 · PMID 42467418 · app store content analysis
- [S13] Lepley et al. (2026). Consumer Smartwatch Technology in Health and Performance Research: Validity, Limitations, and Real-World Applications. Sensors. DOI 10.3390/s26144486 · PMID 42515370
- [S14] Kleiger et al. (1987). Decreased heart rate variability and its association with increased mortality after acute myocardial infarction. American Journal of Cardiology. DOI 10.1016/0002-9149(87)90795-8 · PMID 3812275
- [S15] Hillebrand et al. (2013). Heart rate variability and first cardiovascular event in populations without known cardiovascular disease: meta-analysis and dose-response meta-regression. Europace. DOI 10.1093/europace/eus341 · PMID 23370966
- [S16] Fang, Wu & Tsai (2020). Heart Rate Variability and Risk of All-Cause Death and Cardiovascular Events in Patients With Cardiovascular Disease: A Meta-Analysis of Cohort Studies. Biological Research for Nursing. DOI 10.1177/1099800419877442 · PMID 31558032 · an erratum was published (Biol Res Nurs 2020;22(3):423–425)
- [S18] Kiviniemi et al. (2007). Endurance training guided individually by daily heart rate variability measurements. European Journal of Applied Physiology. DOI 10.1007/s00421-007-0552-2 · PMID 17849143
- [S17] ONDA — product documentation: What ONDA measures. What ONDA measures and how it reads your signals.
Related
- ScienceHeart Rate Variability: What It Is, What It Reflects, What It Isn't
- ScienceHRV Baseline: Why Your Own Normal Matters More Than Any Norm
- ScienceRMSSD — What This HRV Metric Reflects, and What It Doesn't
- ScienceSDNN — What This HRV Metric Measures, and What It Doesn't
- ScienceCan You Trust HRV From a Smartwatch or Ring?
- ScienceWhy HRV Changes From Day to Day
- GlossaryHeart Rate Variability
- ArticleYour HRV Reading Is Low. Now What?
- ArticleWhy Is My Apple Watch HRV So Low?
- ArticleHRV Questions, Answered: 52 Straight Answers About Heart Rate Variability
- ArticleNormal HRV by Age: What’s a Good Heart Rate Variability?
- ArticleDoctors and Your Data: Which Specialist Can Use Your Heart, HRV and Sleep Trends
- ToolHRV Calculator by Age
How ONDA Science pages are made: every number comes from one checked list of facts, every claim is mapped to its sources and graded by strength of evidence, and sources need a DOI or PMID (manufacturer documentation is used only for device facts).